About Team Blender
What is Team Blender?
Team Blender is a web application created in 2024 to compare the cost of work by different Arup office production centres. The tool enables users to build a team by grade and see the average hourly cost of a team with that grade structure in different offices. Users can then specify the percentage contribution of each office, and the tool calculates the overall hourly average rate.
The application is particularly useful for large transport projects (such as metro station projects) where projects may be delivered by multiple Arup teams around the world. Teams can quickly assess how to split work to achieve a particular hourly rate (e.g., at bid stage) or to ensure profit margins are maintained (at delivery stage).
By combining staff rates from multiple office locations with customizable team structures, Team Blender provides accurate cost projections in 36 currencies, including GBP, USD, and EUR (see FAQ question #4 for the full list). Exchange rates are sourced from Arup Data Services (ADS) and updated annually, making Team Blender an essential tool for planning international projects and understanding the financial implications of different staffing strategies.
Team Blender also includes an inflation rate function to support forward-looking planning. Users can apply default office inflation rates or define project-specific assumptions, enabling teams to forecast future-year costs with greater confidence and consistency.
For scenarios not fully represented by existing office data, the Custom Office function allows teams to create project-specific offices and enter their own grade costs. This supports practical option testing, clearer comparison of staffing strategies, and stronger alignment with local market conditions.
When and Where is Team Blender Useful?
Team Blender was created and initially funded by PSI London and has been used widely across the UKIMEA and Europe regions, principally for Transport sector projects. The tool provides significant value in several key scenarios:
- Competitive Bidding: Help Arup submit competitive bids, particularly where market knowledge shows that a specific average hourly rate needs to be achieved for the bid to be competitive.
- Budget Assessment: Quickly determine if a project can be delivered within a client's budget, helping to rule out bids where the numbers don't work.
- Team Cost Calculation: Rapidly derive the average hourly rate for a team composition, saving time in project planning and estimation.
- Scenario Planning: Quickly compare the effect of making changes to team make-up, enabling informed decisions about resource allocation and staffing strategies.
- Multi-Office Projects: Essential for projects delivered by multiple Arup teams around the world, particularly in the transport sector including metro stations, rail infrastructure, and other large-scale developments.
How to Use Team Blender
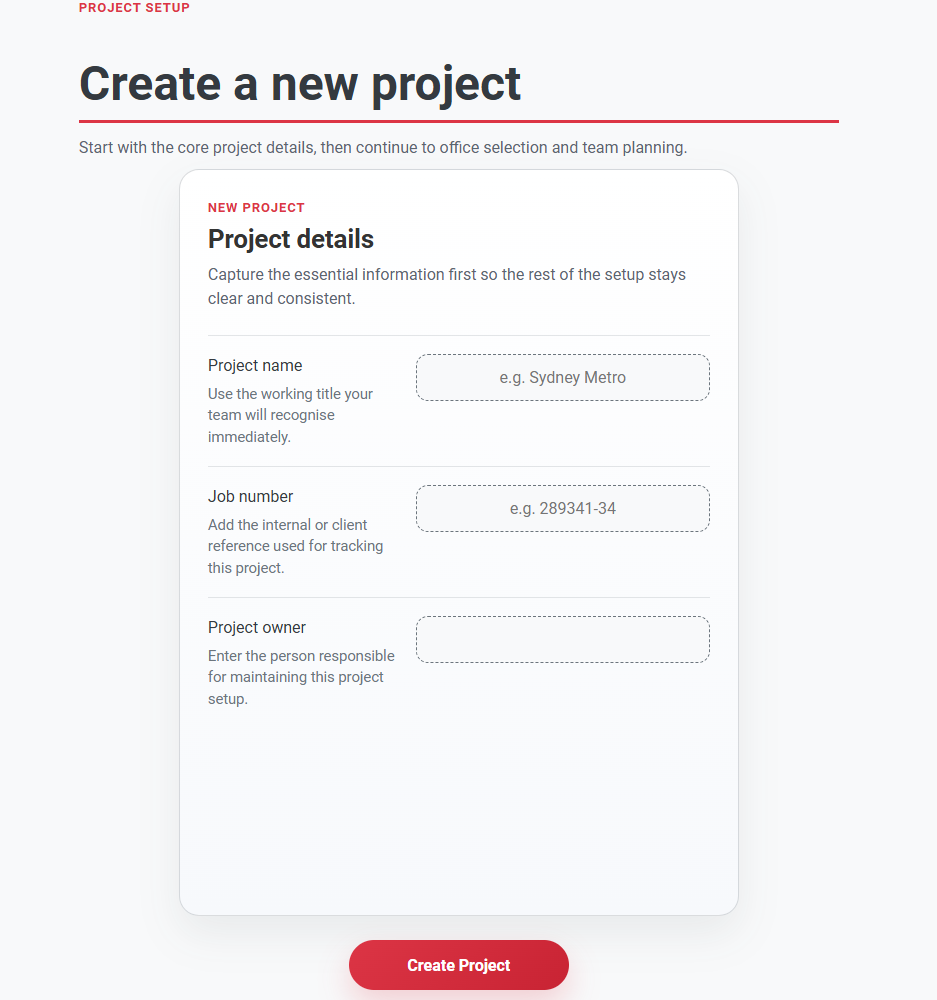
1. Create a New Project
Start by creating a new project and entering basic project information including the project name, job number, owner, and financial year. This forms the foundation for your cost estimation.
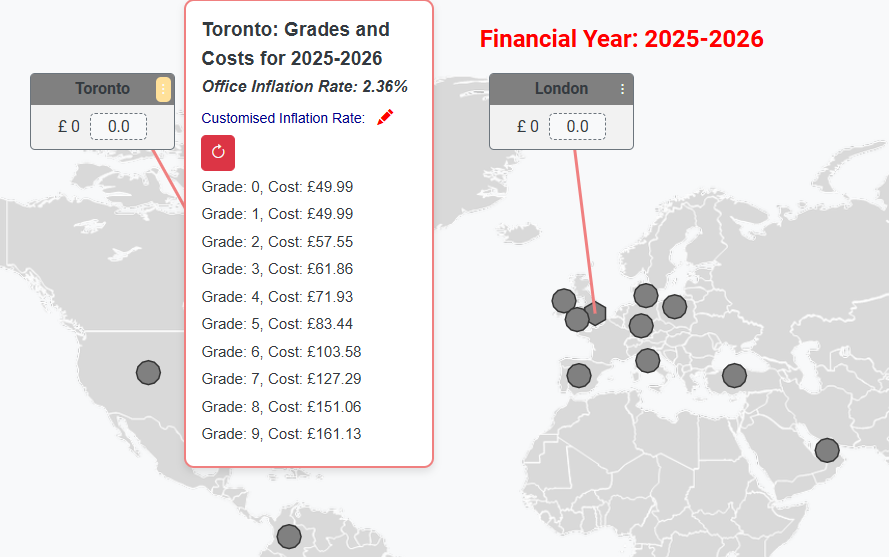
2. Select Office Locations
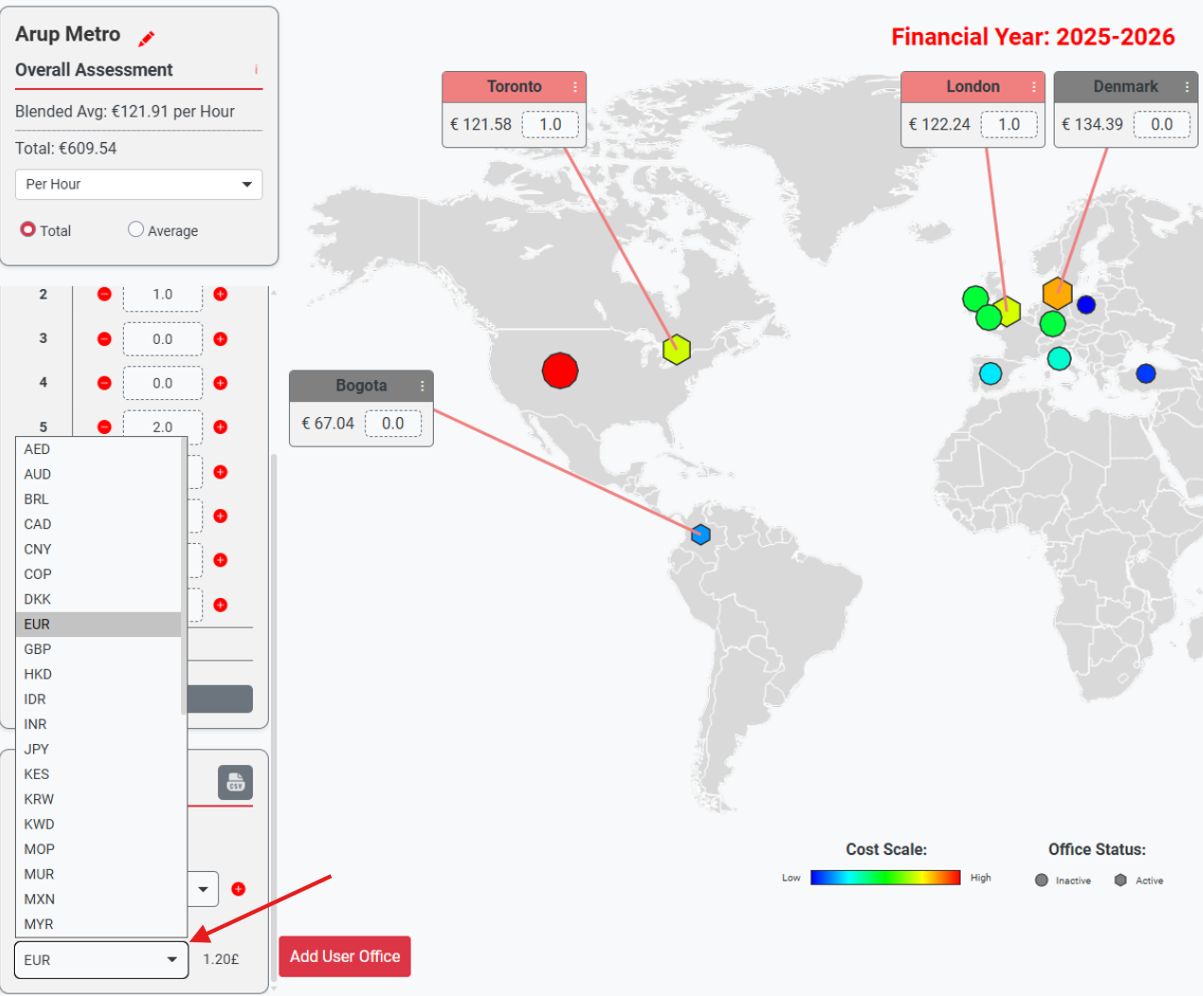
Choose the office locations you want to include in your project team. You can view offices on an interactive world map and see detailed information about each location including region and available staff rates. Click on the three-dot menu next to any office name to view grade costs for that location.
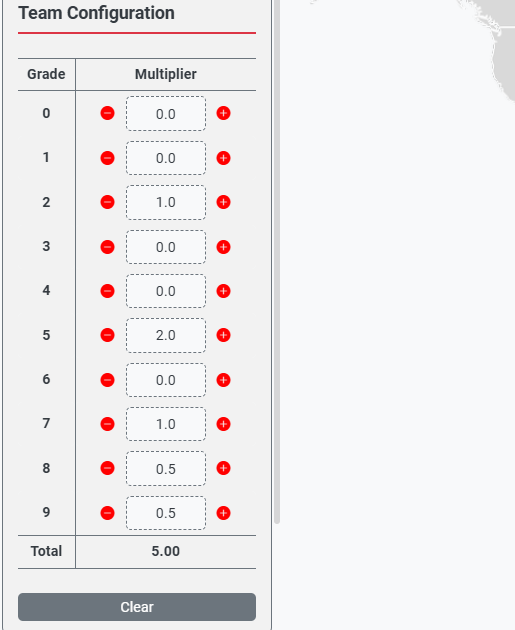
3. Define Team Composition
Use the Team Blender feature to define your team structure by specifying the grade levels and quantities (multipliers) for each role. The application uses breakeven rates (SAL + OH) for each grade in each location to calculate accurate costs. In this example, the team consists of 5 FTE, using staff of grade 2, 5, 7, 8, and 9.
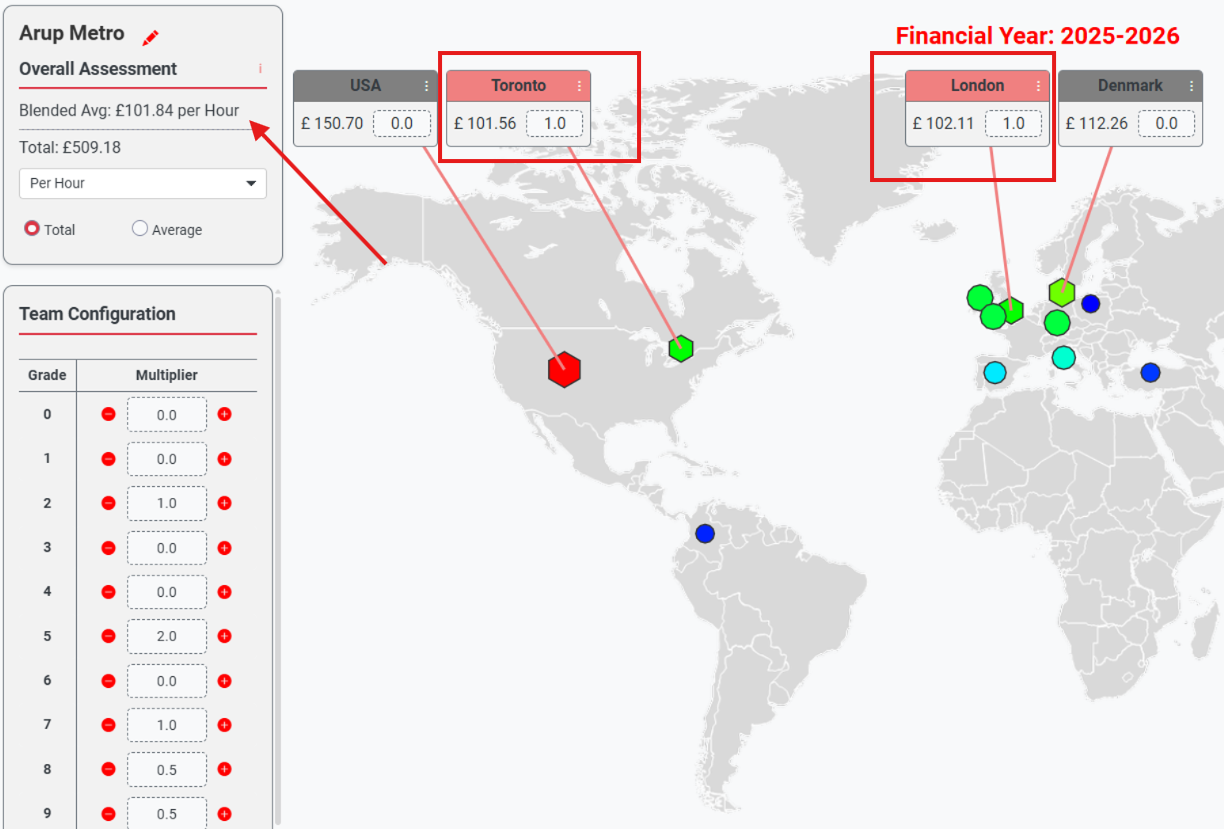
4. Assign Office Weights
Set the weight (multiplier) for each selected office to indicate the proportion of work to be delivered
from that location. The system automatically calculate the blended average hourly rate. For example, a 50:50 split between London and Toronto would be entered as shown. The blended rate is: (1 * £102.11 + 1 * £101.56)/(1 + 1) = £101.84 per hour, as shown in the top-left summary panel.
5. Review Cost Summary
View the comprehensive cost summary showing average costs per office in multiple currencies. The overall assessment displays the weighted average cost based on your office distribution and team composition. You can switch duration from per hour to per week, per month, or per year to match reporting requirements. You can also toggle between total cost and average cost views, making it easier to present estimates in the format most suitable for bids, planning, and project reviews.

6. Manage Currency Display with the Currency Selector
Use the currency selector to change the display currency at any stage of modelling. Office rates and blended rates are recalculated and presented in the selected currency, enabling clear comparison of project cost scenarios across different markets.
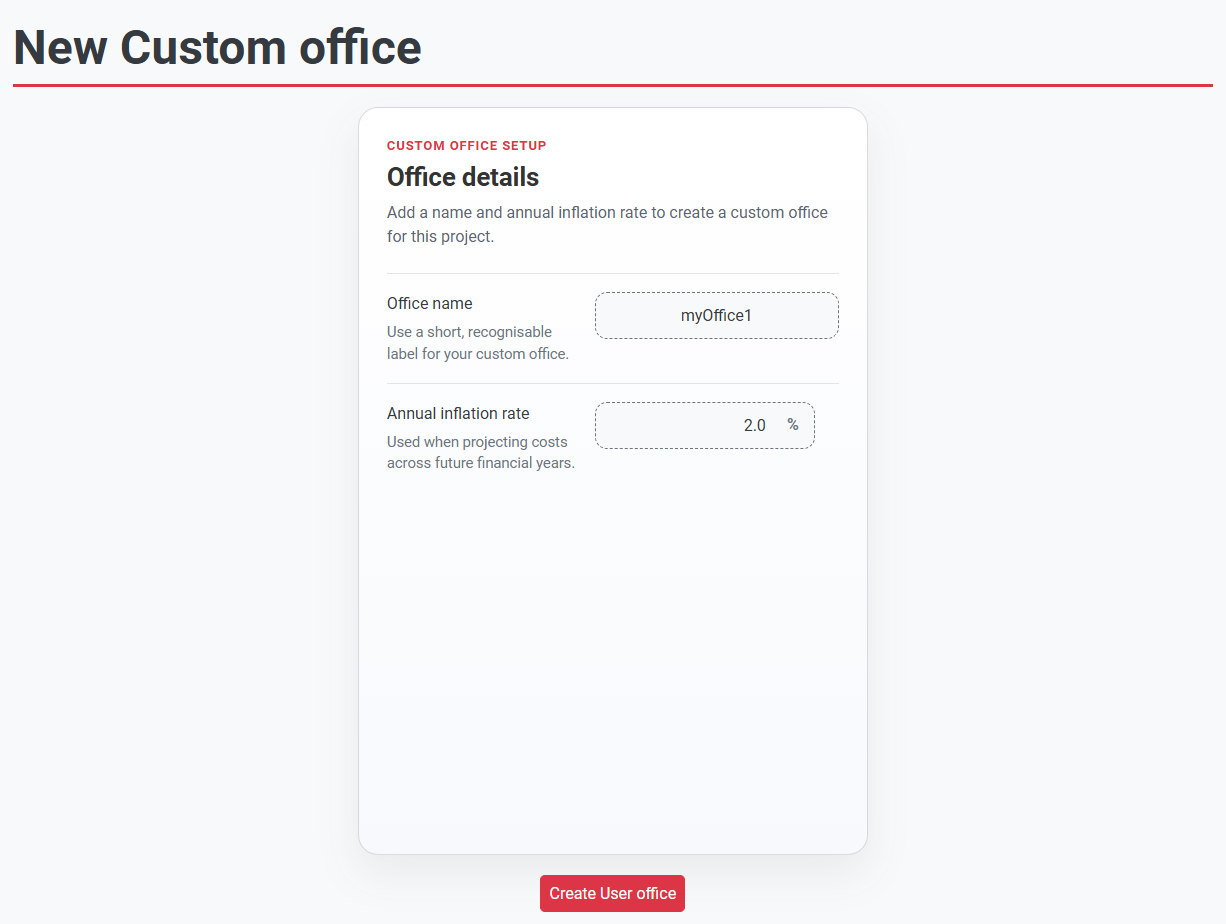
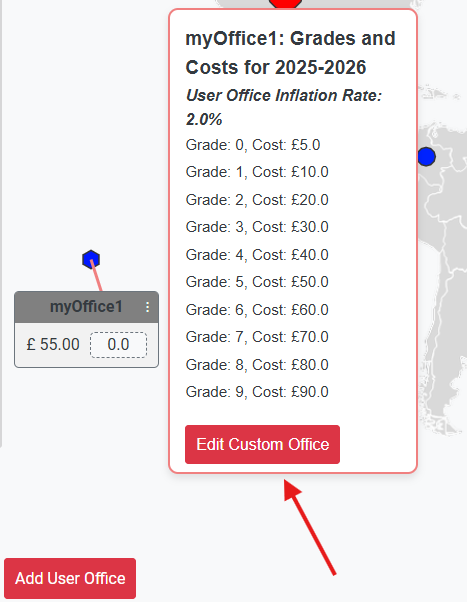
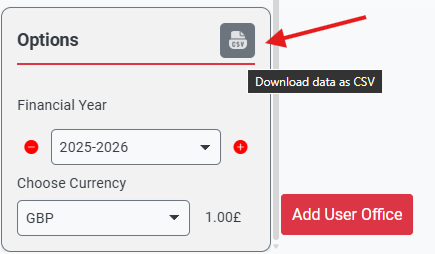
7. Create and Configure a User Custom Office
Use the Add User Office option to create a project-specific office when your scenario is not fully covered by standard office data. Enter and update grade costs for the relevant financial year, then set the office inflation rate to align future-year forecasts with your planning assumptions.
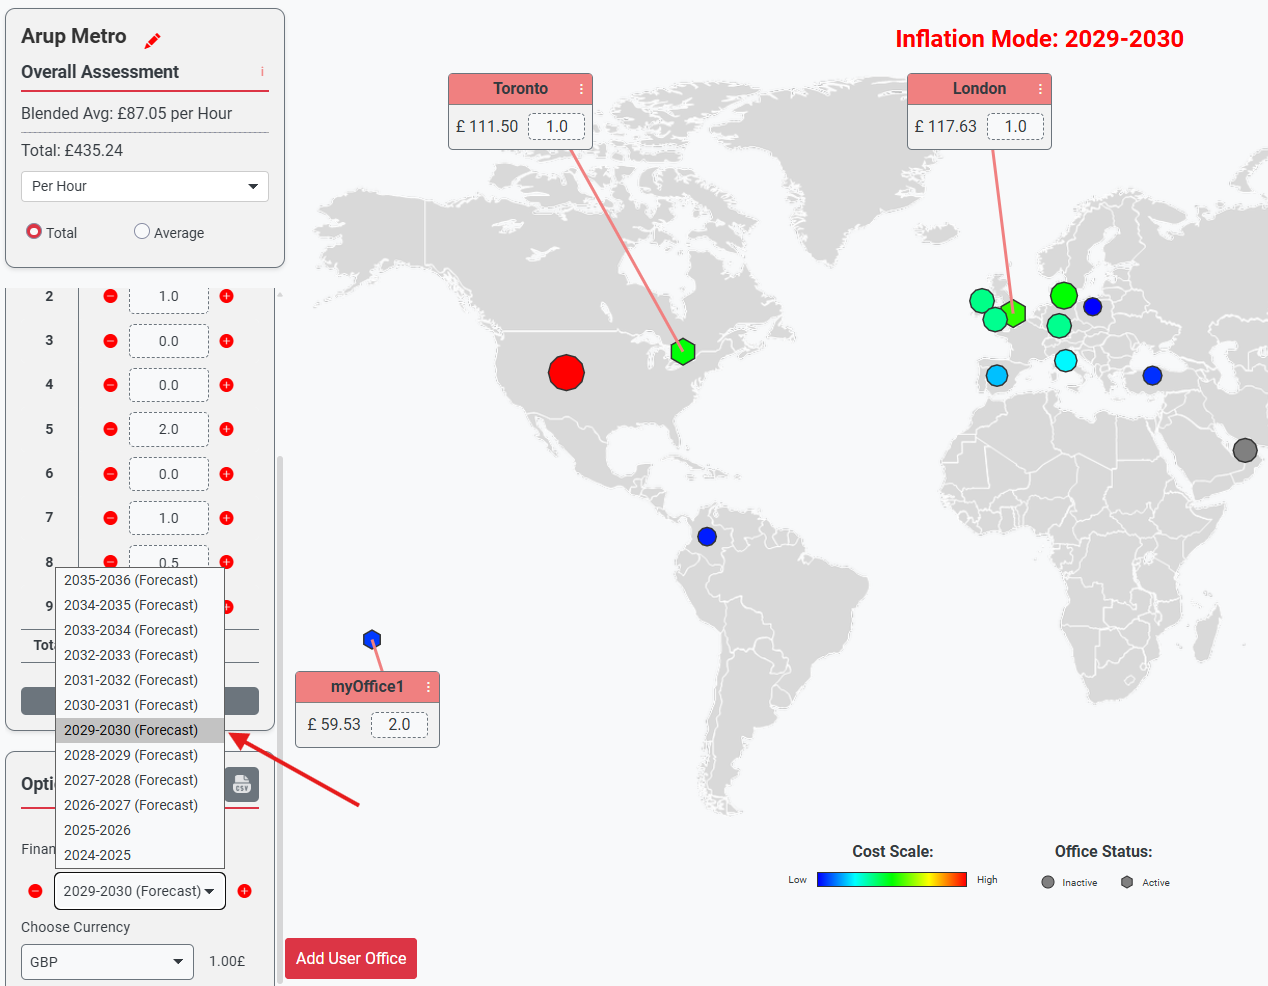
8. Set Financial Year and Forecast Horizon
Use the financial year selector to choose a year from the dropdown list, or use the step buttons to move forward and backward one year at a time. The latest available financial year is treated as the base year, and Team Blender supports up to 10 years of future forecast. This allows you to assess how inflation-adjusted office blended rates evolve over time, while the summary panel presents the blended rate across all selected offices.
9. Export model data to CSV
You can export your model data to CSV for further analysis.
Developed By
Team Blender was created and initially funded by PSI London to support efficient project planning and cost estimation, with particular focus on transport sector projects including rail and metro infrastructure developments that require multi-office collaboration across Arup's global network.

Project Director
Timothy Worsfold

Lead Developer
Stamatios Psarras

Developer
Clara Wang

Developer
Jake Adkin
Following its success and wide adoption across UKIMEA and Europe regions, the tool continues to evolve based on user feedback and suggestions, helping teams make informed decisions about resource allocation and project staffing strategies for complex multi-office delivery projects.